Prometheus and Grafana
This project integrates Prometheus for metric scraping and Grafana Cloud for visualization. This setup allows us to monitor the health, performance, and usage patterns of the Turing API in real-time.
Implemented Metrics
We utilize the prometheus-fastapi-instrumentator to expose both standard system metrics and custom business logic metrics.
Custom Metrics
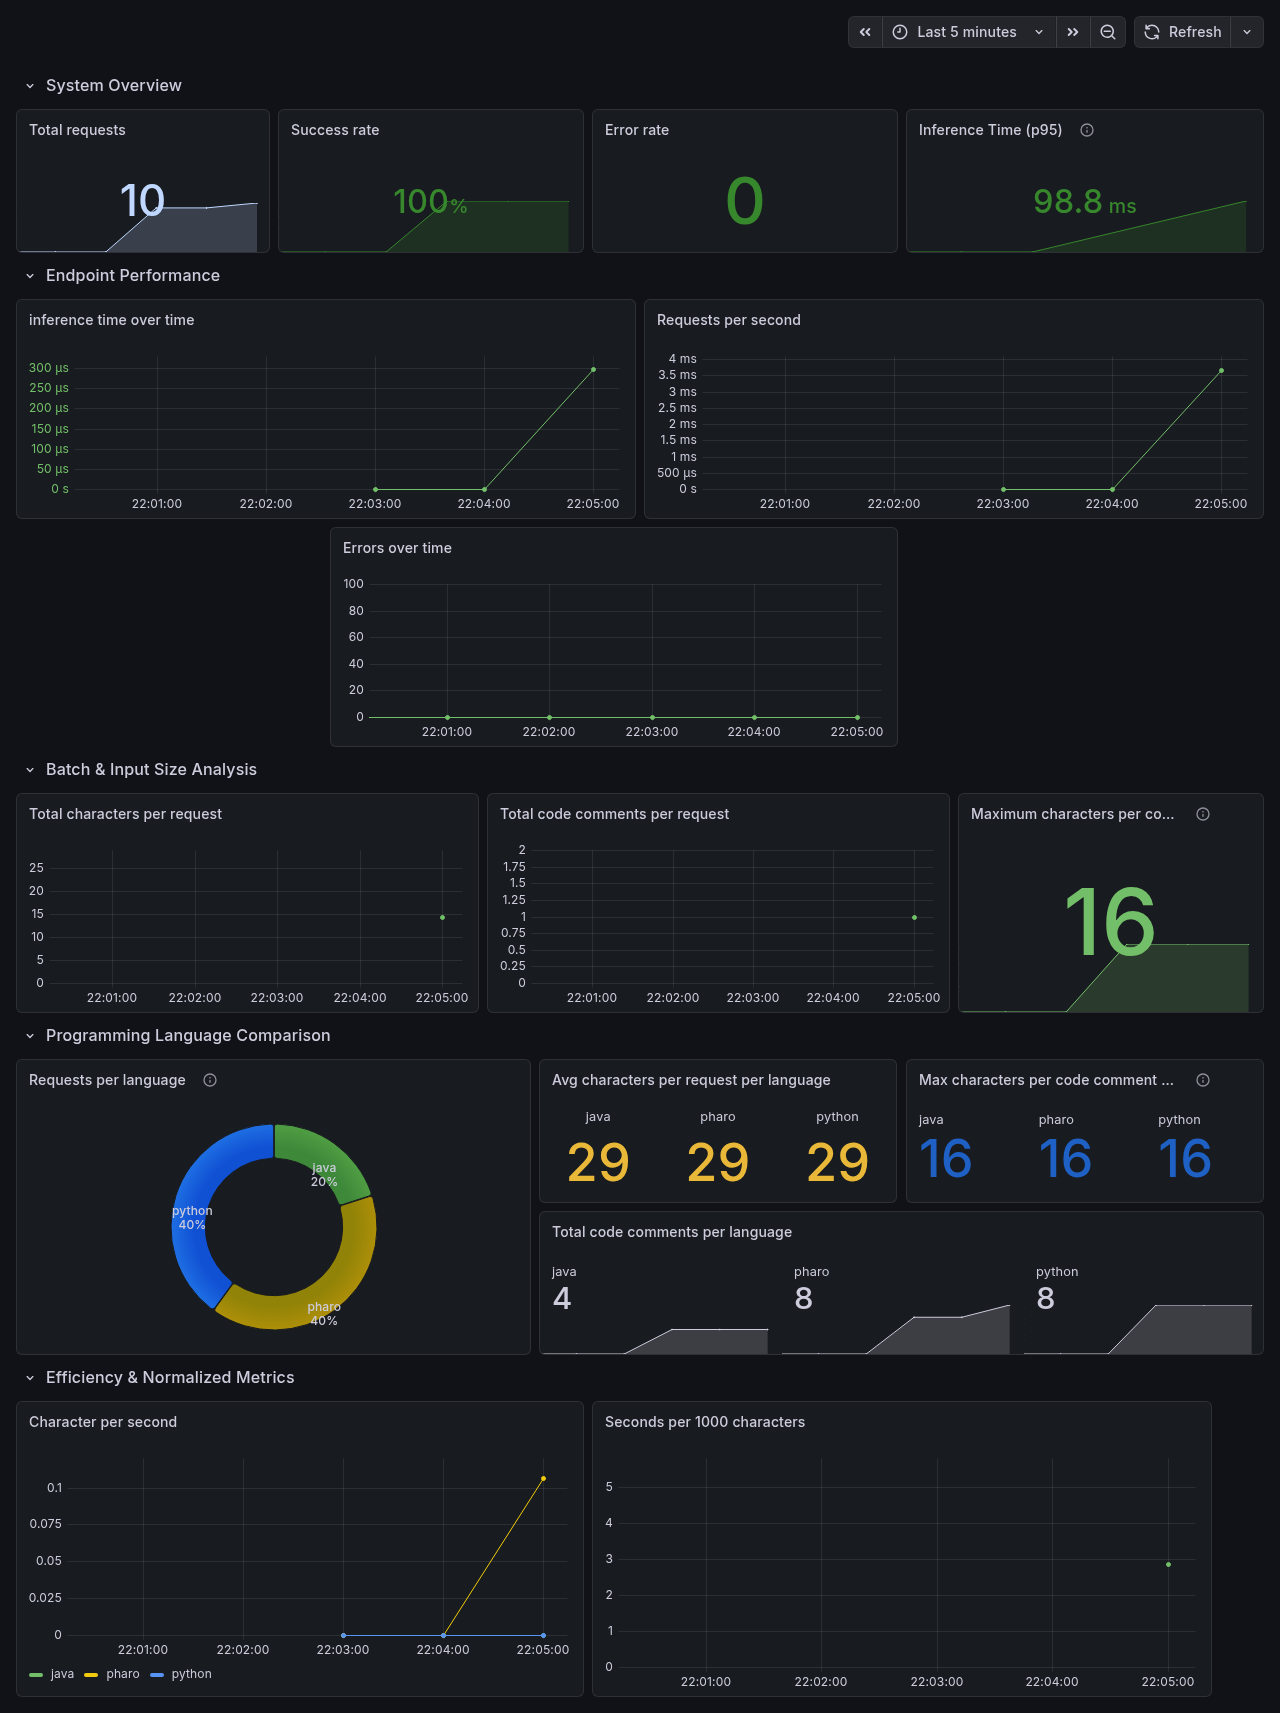
The following metrics are tracked to analyze model usage:
http_requests_total(grouped by language):- Tracks how many requests are made for each programming language (Java, Python, Pharo).
- Usage: Identify the most popular languages and potential resource hotspots.
turing_processed_comments_total:- Counter for the total number of code comments processed by the system.
turing_processed_chars_total:- Counter for the total number of characters processed.
turing_comment_length_max:- Gauge tracking the maximum character count in a single request.
To support granular tracking, the /predict API route was refactored to accept the language as a query parameter (e.g., /predict?language=pharo), making it
easier to parse in middleware.
Prometheus
Local Prometheus Server
The local Prometheus instance is configured using turing_local.yml.
It scrapes metrics from the local FastAPI application.
Configuration details:
-
Scrape interval: 15 seconds
-
Target:
localhost:8000
This setup is useful for development and debugging.
Hosted Prometheus Server (Hugging Face Space)
The hosted Prometheus instance is configured using turing_cloud.yml and runs on a Hugging Face Space:
Hosted Prometheus:
https://turing-team-turing-promethetus-server.hf.space
This Prometheus server scrapes metrics from the FastAPI application deployed on Hugging Face:
Turing API (Hugging Face):
https://turing-team-turing-space.hf.space
Configuration details:
-
Scrape interval: 15 seconds
-
Target:
turing-team-turing-space.hf.space -
Scheme:
https
ℹ️ The FastAPI application must expose metrics at
/metricsfor Prometheus to scrape successfully.
Grafana Cloud
Grafana Cloud is used to visualize metrics collected by the hosted Prometheus instance.
Prometheus sends metrics to Grafana Cloud using remote_write, allowing dashboards and alerts to be managed centrally.
How to Run & Access Local Prometheus and Grafana
Prerequisite
Ensure that Prometheus and Grafana are installed locally.
If not, follow the setup guide here:
Prometheus and Grafana integration
1. Start the Application
Run the FastAPI application locally:
uvicorn turing.api.app:app --reload
2. Access Raw Metrics
The application exposes Prometheus metrics at:
http://127.0.0.1:8000/metrics
You should see output similar to:
# HELP ... # TYPE ...
3. View Grafana Dashboards
Once Grafana is running, open:
http://localhost:3000
Use this interface to explore dashboards and visualizations.
4. Run Local Prometheus
Start Prometheus using the project configuration file:
prometheus --config.file=turing_local.yml
Prometheus will begin scraping the local FastAPI application at the configured interval.
Grafana Interface